
Measuring the ANZACs Tutorial 5: Attestations
In our first four tutorials (One, Two, Three, Four) we covered classification, and marking of Death Notifications and History Sheets, including the Statement of Services. Today we move along to the last key document in the files: the attestation (Check out the Field Guide for a shorter synopsis)
We’ve emphasized in previous posts how Measuring the ANZACs is trying to create an efficient index to the documents. We’d love to transcribe everything right now, but it’s more realistic to think we can do some key information that tells us the kind of people we have in the files, who they are, and the types of things that happened to them.
You can think of the three different types of form we’re collecting in this way
- Attestations describe who men were when they arrived in the New Zealand Expeditionary Force. It’s a snapshot of their life at the start of their engagement with the war. We call this “cross-sectional” data in our analyses.
- The History Sheet and Statement of Services describes key events that happen to men in service, and after. We call this “longitudinal” data in our analyses.
- The Death Notifications are a memorial to those who fell in service, and tell us something about men’s post-war lives. Ultimately the research team want to study how men’s lives and health before and during the war influenced how long they lived.
So the Attestations are like a survey of men before their lives were changed by the war. New Zealand burned its census records after the results were published. While family historians and social scientists have used the censuses in Canada, Britain, Scandinavia, and the United States to study social life in the nineteenth century and early twentieth century, New Zealanders can’t do that. The military attestations are like a census of 10% of the New Zealand population in the early twentieth century, telling us about men’s occupations and birthplaces and education.
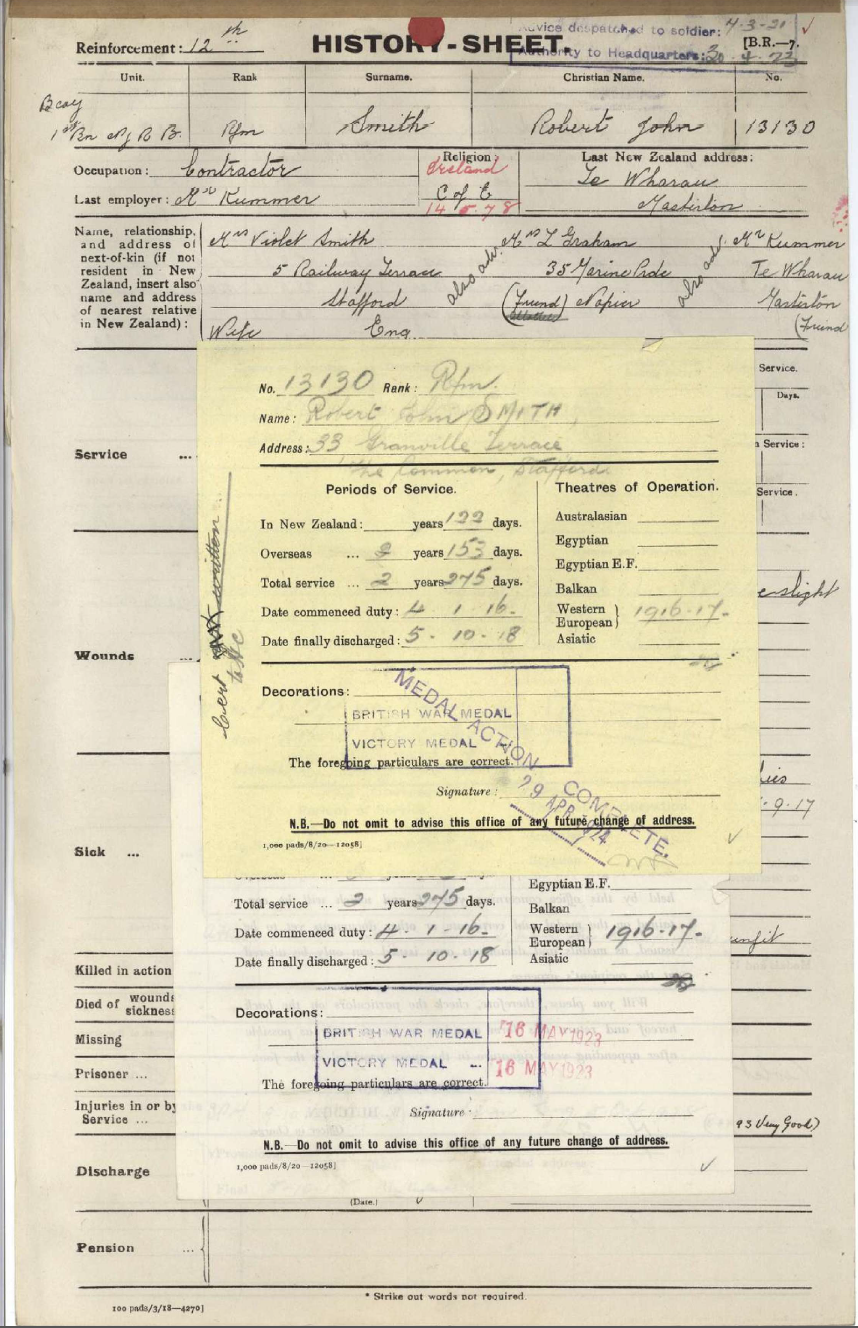
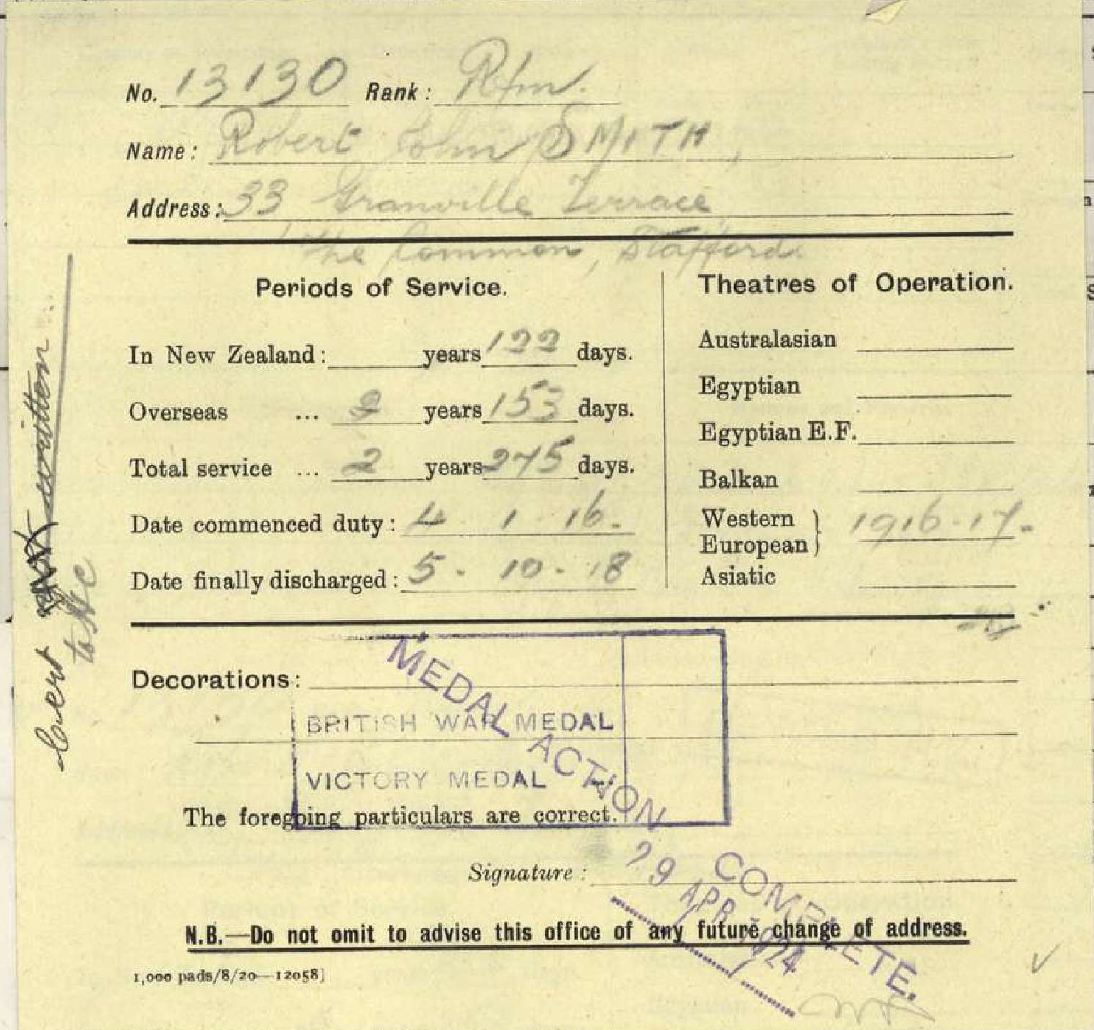
Because the attestations are cross-sectional, they are a little easier for the research team to analyze. We don’t need to order a series of events like we do on the Statement of Services or the History Sheet. The Attestations are also mercifully free of the sticky notes that were a design challenge for the History Sheets.
But there was a design challenge with the attestations. The form changed significantly over the course of the war. The research team has a database of 23,000 men from World War I , so we selected two attestation dates from each month of the war. We looked at the questions asked in each month, and found there were more than 30 different versions of the form. It’s really hard to predict what will be on each form! That’s where you, the citizen scientists of Measuring the ANZACs come in. You have to recognize what’s on the form, match it to the questions we’re expecting, and draw the boxes for transcription.
A final design challenge with the attestations was that some questions are conditional or multi-part. They ask, for example, “Have you served in the military before”. If you have they sometimes ask, what branch, and how were you discharged? Across the various versions of the form we have seen two, three and four part questions. They’re the hardest to recognize.
With that background, lets look at how we identify an attestation and then mark it.
Identifying an attestation
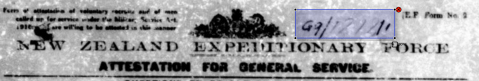
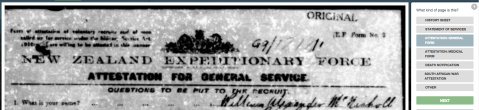 One way to identify an attestation is that it says so right up the top! A lot of the forms are also labeled E.F. Form No. 2 (E.F. stands for Expeditionary Force). Many of these forms will appear to be of poor quality. The original paper copies were microfilmed in the the 1960s, and some of the original destroyed for some files. New paper copies were printed from the microfilm, and inserted into the files. These copies were then scanned in the 2000s to create the images used in Measuring the ANZACs. But you will see some original attestation forms, and in some files you’ll notice two versions. Please identify and mark both! It’s better to have too much information than not enough.
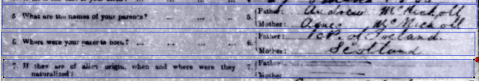
Another way to recognize the Attestation (General Form) is the initial sequence of questions which often starts with the recruits’ name, and questions about his birth date, birth place and next-of-kin. The questions about kin vary tremendously in form across the war. 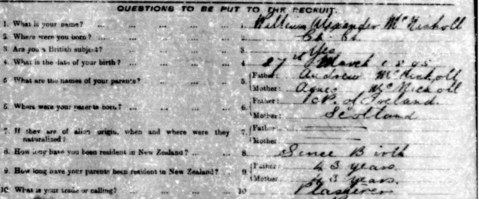
Marking the attestation
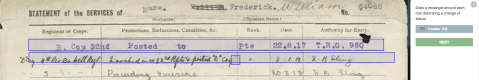
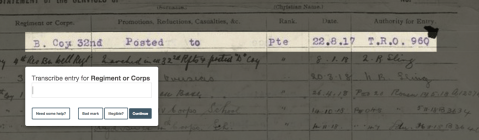
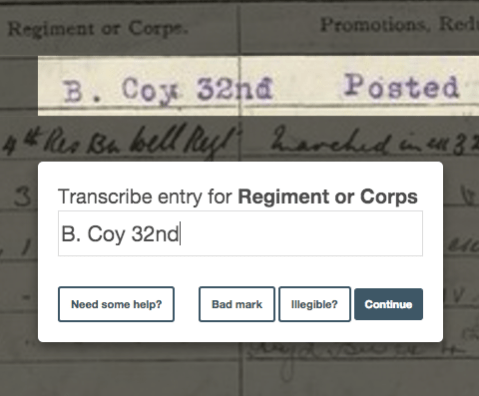
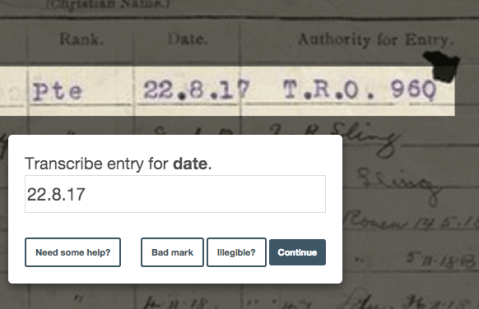
The first thing you’ll be asked to identify is the serial number which is written in the header of the page. The location of this can vary tremendously. Sometimes it’s in a specified place and labeled serial number or regimental number. Other times it’s just written in the header. We’re asking you to transcribe this as a check that we’re getting the right serial numbers associated with the right person.
We then ask you to identify the various questions, with slightly different dialogs for the format of the question. 
Here are some examples of one-part questions marked. Notice that the boxes can overlap a little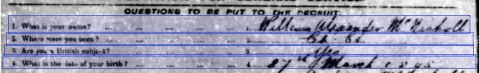
The next questions (below) are two part questions, asking the same thing about the recruits’ father and mother. These are quite obviously two part questions because they ask about two things, and there are two lines.
But there are more complicated two part question as seen in these examples
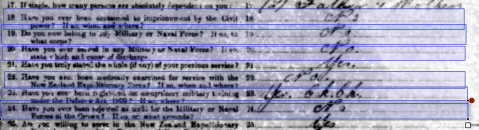
Lets take a closer look: The first question has the form “Did something happen”, and the second part has the form “If so, tell us more”

We go all the way down the page marking sections where there are questions or text, making sure to conclude with the date and place of attestation, which is at the bottom (Christchurch, 24th day of August 1917 in this example, it’s hard to read).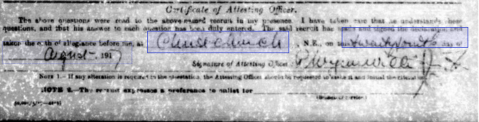
How does this work when we get to transcription?
Because there are so many different forms of the question we, unfortunately, have to solicit your help in transcribing the questions too. 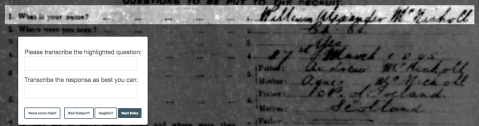
Luckily the question text is printed, and easier to read! You don’t need to transcribe the number of the question.
Here’s the next entry for which we’re doing the same thing. Note that we’ve transcribed the birthplace here exactly as written “Ch Ch”. We know this is Christchurch, and we’ll be able to classify it as such without you needing to correct the abbreviation.
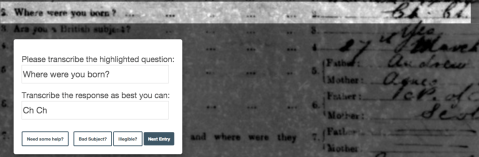
If you think a mark has been placed around the wrong place on the page you can select “bad subject”. Sometimes in marking people draw erroneous boxes. This is our way of handling them.
If you can’t read the text please mark “Illegible.” This is more helpful than a bad guess. If it’s marked Illegible it’ll be offered up for someone else to transcribe. This is the power of the crowd! We try to distribute the work to someone who can do it.
In our next tutorial we’ll turn the page again, and look at the medical part of the attestation. This is a really important part of the researchers’ data collection, and it turns out to be one of the simplest pages to mark and transcribe. The information and layout didn’t change much, and the writing is often much better.
Happy marking and transcribing, and thanks for Measuring the ANZACs with us!
Measuring the ANZACs Tutorial 4: Statement of Services
In our first three tutorials (One, Two, Three) we covered classification, and marking of Death Notifications and History Sheets. Today we turn the page (literally!) from the front of the History Sheet to its other side, the Statement of Services.
Before we dive into the details of the Statement of Services, lets recall our research goals. The research team are interested in how wartime service and experiences affects people’s health after the war. We know that other historians are interested in various ways in questions like “Who served in which battles, and with who, and what happened to them”. Knowing who was where when can tell us a lot about the connections between people in New Zealand society before, during and after the war; and it can tell us a lot about the military history of the New Zealand Expeditionary Force.
The Statement of Services helps us with these diverse research questions by summarizing the units in which men served, and for what periods of time. Operational histories of the units that have been published by the New Zealand Electronic Text Centre at Victoria University of Wellington will allow us to attach further detail about where men were serving on any given day of their service.
In short, the Statement of Services, like the front of the History Sheet is a very efficient way of summarizing the material in a man’s file. We can’t transcribe everything in a man’s file, so we are concentrating on material that will help you, and help researchers, zero in on the people they’re interested in for further exploration.
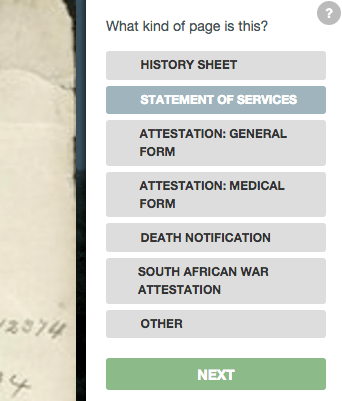
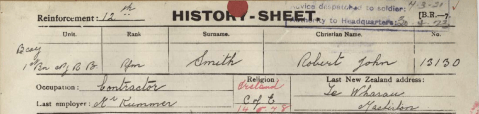
1. How do I recognize a Statement of Services?
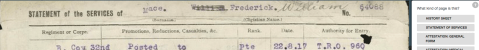
Most of the time, it says so right at the top of the page, and you can jump over to the right hand of the page to classify this as a Statement of Services.
If the title is obscured you can recognize it from the data elements or columns that are listed
- Regiment or Corps
- Promotions, Reductions, Casualties
- Rank
- Unit
- Authority for Entry
2. Marking a Statement of Services
First mark the page as a Statement of Services, and then click NEXT.
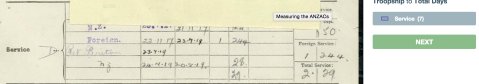
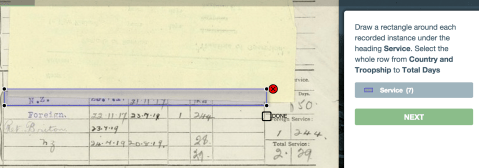
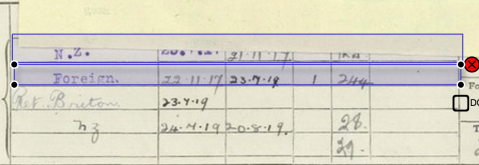
Although we have multiple fields (columns) here, we ask you to mark whole rows. This means that when you (or someone else) transcribes the entries the material from each row is associated with each other. This is incredibly important in letting us create an accurate database of what happened to each person, with the correct dates for each change of status.
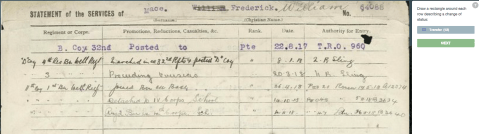
Click on “Transfer” and then mark a row. It will now look like this. 
Then mark another row.
and so on, until you have marked all the rows. 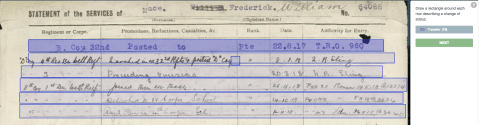
Once you have marked all the rows you can click Next. Then we ask you to scroll down and mark the Particulars of Marriage if there is any information there. This will be really useful information for family historians.

As with the Transfers, you should draw across the whole row.

If there are any children, mark each child separately. 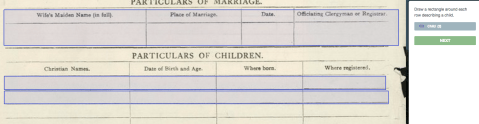
Finally, we ask you if anything is on the Conduct-Sheet section of the page. Our goal here is to index the men who had conduct incidents (really, misconduct) and re-sample those pages for transcription later in the project when we’ve transcribed everything we’re starting with. 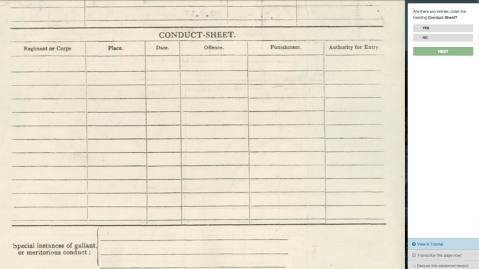
And that’s marking a Statement of Services. The key to doing it correctly is marking the whole row, and marking each row of information separately.
3. Transcribing the Statement of Services
Switch to the Transcribe mode, and you will see how your work interacts with the data. Remember, you marked each row, but now we’re dividing up the data into the fields you see there.
Type what you see in each box.
You can move the boxes around. With the dates it’s especially important that you type what you see, and being careful not to omit the punctuation between the day, month, and year.
Once every row is transcribed and in our database, we can calculate how long a man was in each “status” by sorting the transfers by date, and calculating the difference between each sequence of events.
You are welcome to transcribe the original entry instead of the “ditto” marks. But if we have all the events in place we can actually work out what the ditto marks are by looking “up” the electronic version of the data to see what the ditto mark is referring to.
Now we’ve completed looking at the documents describing what happened to men during the war, our next tutorials will look at the attestations which have different information and different challenges.
Evan Roberts
Measuring the ANZACs Tutorial 3: Marking History Sheets
In our last blog post we covered the basics of Marking. Marking is fundamental to capturing the information off the personnel files, as it structures the information that will be transcribed into “fields” or “variables.”
You can think of the fields as equivalent to columns in a spreadsheet. Every row describes a person, and every column has the same kind of information in it: a name, a birth date, a birth place, etc … The structure of the data gets a little more complicated than that because some things can appear multiple times for the same person. For example, people could get sick, or be wounded multiple times. This means the data is hierarchical (a future post will look at how we process the data for research).
The History Sheets (see the Field Guide) are a vital part of our research because they describe the “exposure” that soldiers had to sickness, wounds, and battle. They are also vital in making the Measuring the ANZACs database a platform for other researchers to do further research in the personnel files. With more than 4 million pages for 140,000 personnel files it’s unrealistic to think we can transcribe all the information (but if every New Zealander transcribed three pages we’d be done …) in a short time. The History Sheets summarize the key events that happened to men, and will help us create a highly refined index of the men who served according to many different criteria including where people served, when they served, where their hometown was, whether they were injured, and who their next of kin were. The importance of an index like this might be appreciated with this example: at the moment we have no way of identifying the personnel files of those who served at Gallipoli.
In short, the History Sheets are valuable because they summarize so much about a person’s service. This will let researchers, including you (!), delve into the stories in other parts of the file. The History Sheets are like a menu to what else we might find in a man’s file.
As we noted in one of our first blog posts, the History Sheets were working documents for the administration of an army and a welfare system for returned soldiers (veterans). Their history as working documents is reflected in the “sticky notes” that are affixed to many of them, particularly ones that record a long history of service. This was a particular challenge in designing the interface you are using to mark and transcribe.
As we noted in an earlier post the way Archives New Zealand dealt with the challenge of the sticky notes was to scan the same page multiple times to capture the information on the sticky note, and what was hidden below. It is very important that you classify all views of the same page as a History Sheet, and mark the fields on it, even if there is some duplication.
Identifying a History Sheet: Most of the time you can identify a History Sheet because it says so at the top of the page.
But not always … Because these were working files, and the History Sheet often appeared at the top of the file it was more likely than other parts of the file to be covered up with tape, like this …
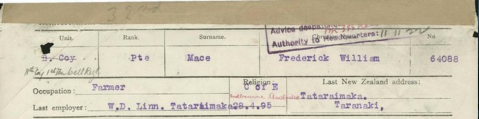
So you need to be able to identify a History Sheet from the key elements that nearly* always appear at the head of the page: Unit, Rank, Surname, First Name, No., Occupation, Last Employer, Religion, and Last New Zealand address. These are key pieces of summary information that were often taken from the attestation. Another way of identifying a History Sheet is that they are often a beige or tan color. (* Citizen scientists have seen other examples of the History Sheet. If you’re unsure, click on “Discuss this personnel record” in the lower right corner of your screen, and find out from the researchers, moderators and other citizen scientists over in Talk.)

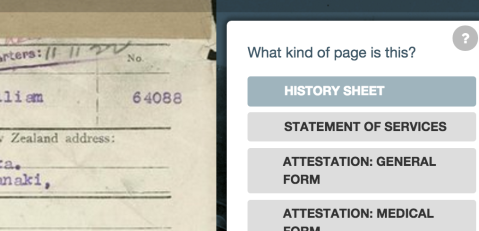
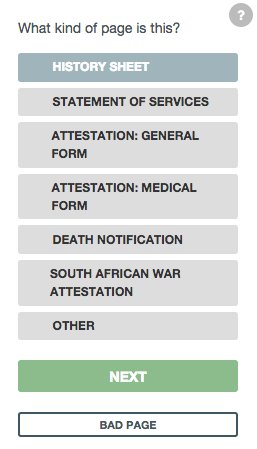
1. Identify the page as a History Sheet.
In the Mark workflow, you’ll click on History Sheet, and then click “Next”
2. Tell us if there are any sticky notes on the page.
After you’ve identified this as a sticky note you’ll be asked are there any sticky notes, and in this case we click “Yes”.
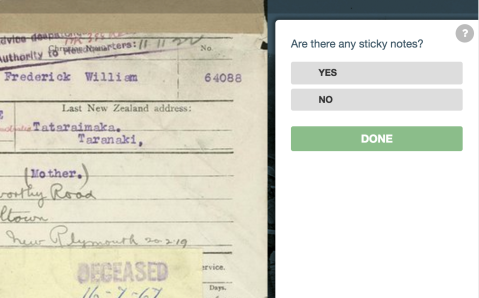
and then click “Next”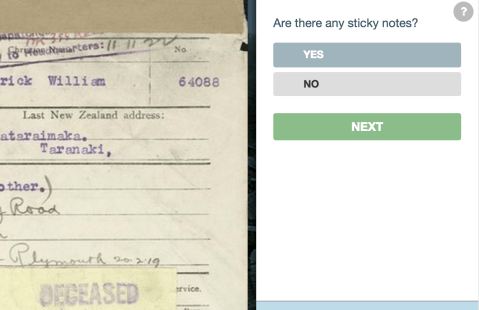
3. Now you’re onto the Marking of the individual fields
There are a lot of fields on the History Sheet, and it presents you with the options in the order we expect to see them. 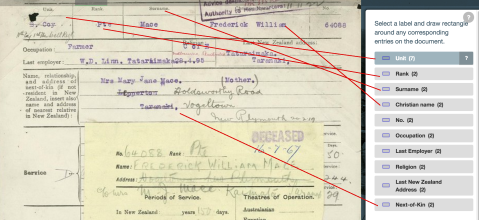
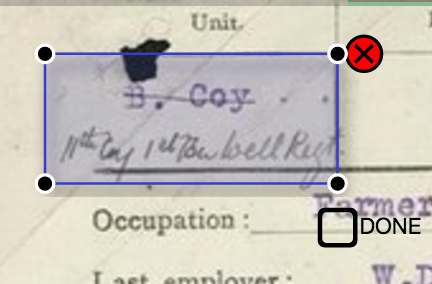
Select a field in the list on the right, and find the corresponding space on the form where the answer to that question is written. Draw a box around the answer, and when you’re satisfied with the box, click “Done”.
Now your box will show up ready to be transcribed by you or someone else from our great force of citizen scientists.
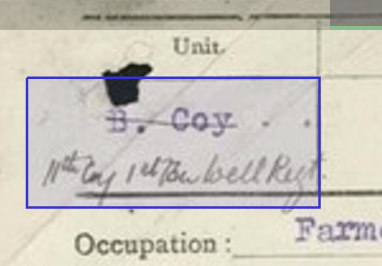
You do the same thing for all the other fields for which the answers are visible on this page.
Scrolling down the page you’ll notice that the “question” for Service is visible, but the “answers” are hidden by the Sticky Note. Don’t mark any fields on the Sticky Note, or fields which are obscured by the Sticky Note.
If you want to see what the next page looks like you can navigate to the next page by using the page navigation tool on the left side of the screen. Click on the this icon to see the next pages.
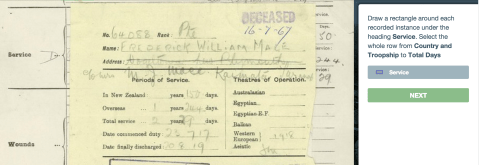
4. Marking Service, Wounds, and Sickness rows
Our next view of the same page shows what’s under the Sticky Note. Here we come to the information that summarizes a man’s service. The key thing about marking this section is that you make multiple marks, one for each row in which there is information.
Note the instructions about which parts of the row to select. The next three screen shots show us doing the first three rows here. You’ll note that the boxes can overlap, because the writing sometimes spilled over the lines.
1. First row of service marked
2. Second row marked
3. Third row marked, notice how it overlaps the second row
These same principles apply to marking Wounds and Sickness, which could happen multiple times to people. Mark each separate instance with a different box. This is very important, because it helps us create a count of the number of “events” that happened to people. Eventually we will use the separate information from each row to compile an electronic history of each man’s service. We will be able to calculate things like how long a man was sick during the war, and how long he was suffering from wounds.
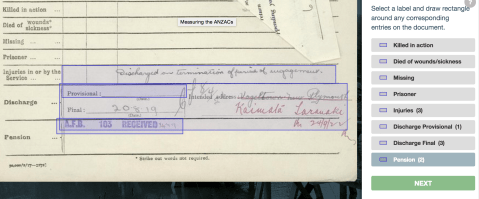
5. End of service
Finally we come to some fields that often describe the end of a man’s service in various ways: death, missing in action, being taken prisoner, and discharge; and some information on pensions.
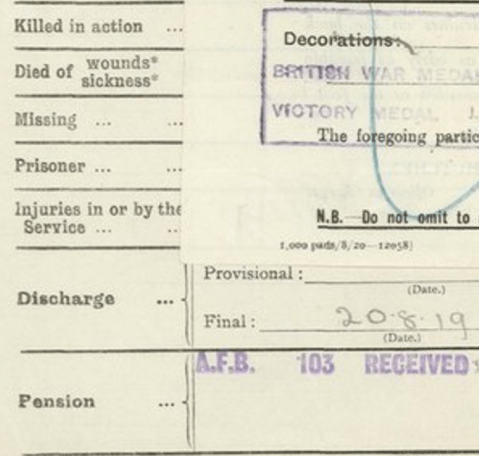
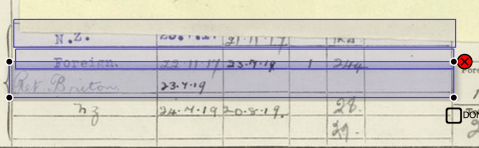
Some of this is obscured by another sticky note, so lets hop over to the final version of this page to see what’s there. We have some information in the “Injuries row”, some information on a final discharge date, and an entry in the pension row.
For the discharge fields we are most interested in the dates of discharge. Here you’ll see that he leaves on 20.8.19 (20 August 1919). We’ve noticed some people have included the intended address in these fields, and that’s OK. It’s quite easy to identify what is an address, and what is a date.
And then we’re done with marking this page. You can click on “Transcribe this page now!” if you want to transcribe, discuss it in Talk, or share your find on social media.
Or if you just click Next you’ll move to another page for marking.
This covers the basics of marking a History Sheet, and will hopefully get you through most of them. Some are more complicated, so join the conversation in Talk by clicking “Discuss this personnel record” if you have any questions to ask about a particular page. All questions are good questions, and we have a great force of researchers and citizen scientists who want to help. Thanks for joining the forces to Measure the ANZACs!
(Here’s a link to the file we were using for the screen shots)
Measuring the ANZACs Tutorial 2: Marking pages
A couple of weeks ago in our first tutorial post we covered how to classify pages. Knowing what kinds of documents are in each file is a fundamental step in organizing this material for research. Classifying pages is also important in streamlining the marking and transcription work that you will do on Measuring the ANZACs. We have about 150 different fields of information that can be collected from the forms. Knowing what type of page you are working on helps us present you with a smaller list of things to mark.
Even then, we still face some challenges. We discovered about 30 different versions of the Attestation form that vary slightly in terms of the questions asked. Just today one of our citizen scientists, Zanna640, discovered a version of the History Sheet we hadn’t seen before. It seemed to have fewer fields, but also some different ones, than the ones we were used to.
Lets look at the basics of marking by looking at a death notification, which has the fewest fields to mark and transcribe. There are two different types of death notifications you’ll see, depending on whether someone died in service, or many years after. The example we’ll use here is a notification of a death in the field.
Before we go onto the details of marking, why are we collecting this information on a separate form? For people who died in service the information confirms what we have on the History Sheet, or adds the information if, for some reason, the information on the History sheet doesn’t get picked up. One of the fundamental principles of research is to build in redundancy for important information so you don’t lose it (you’ll sometimes notice that surveys ask you both your age and your birthdate. This is the same principle in action).
For the majority of men who died after service, the death notification lets us narrow down their search for their death certificates. One of the important research questions the research team is addressing is “how did your health in early life affect your lifespan (if you survived the war)?” Getting the death dates allows us to know how long these men lived, and then makes it easier for us to request death certificates to find out what people died of.

Here’s the form. We recognize it as a death notification because the text at the top says “Report of Death of a Soldier”.
Once it has been marked as a death notification this helps us narrow down what fields there are on the page. Thus, the workflow of Classifying pages, Marking, and Transcribing has an order which is important in making your job easier, and our data better. In this case there are only a few fields on the page — the possible fields you can mark are shown on the right hand side of the page.
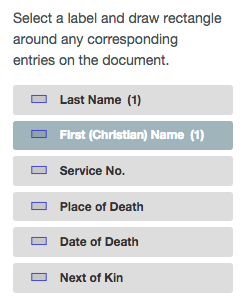
Now you look at the page for where is a last name. In this case the last name is not explicitly and separately present as a question. It’s combined with the first name. But as a citizen scientist you know that when you see “OneName, TwoName” with a comma in between the first item in the list is the last name. So you draw one box around that, and another around the first name.
The Service No is again not there as an explicit question. Here it’s recorded as Regiment No. This is another of our challenges in Measuring the ANZACs, that the same concept is sometimes referred to by different words and we have to rely on you, to recognize the similarity in the concepts despite the difference in words.
“Place of Death” is not on the form as such, but this is a death notification and there is a “Place” question, so we mark that as “Place of Death.” Similarly with Date of Death. On this form you won’t find a Next of Kin. On the post-service death notifications you will.
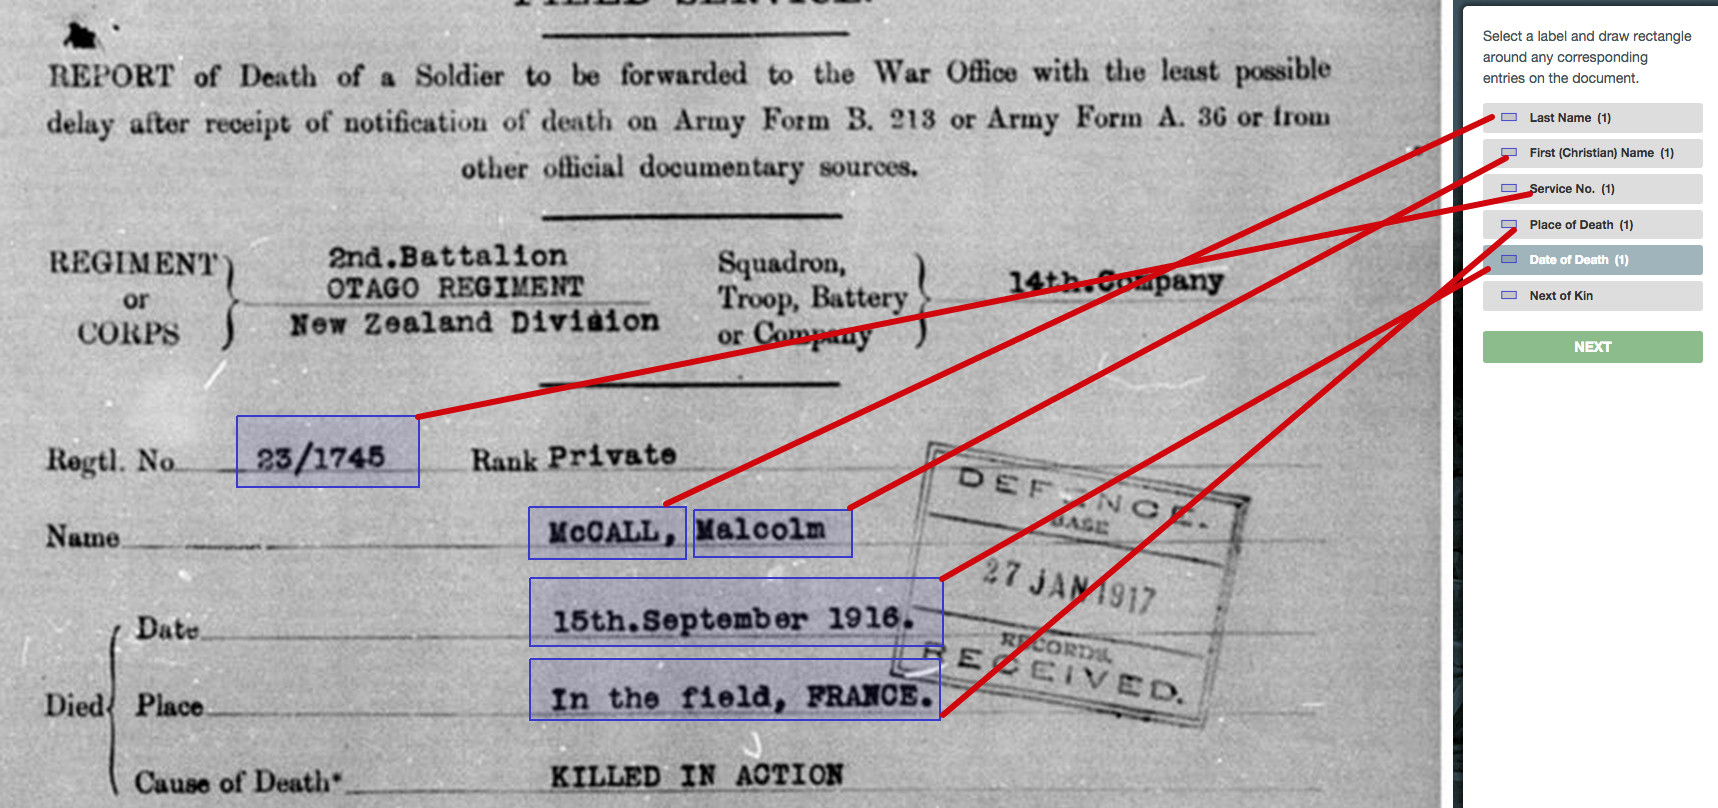
And there it is, our marked up death notification. Now you’re ready to start transcribing (if you like), or move onto marking another page. In conclusion, marking is an important part of our process by helping us get the correct data into the correct places. It asks that you, our citizen scientist collaborators, recognize the places where a concept from the field list matches an item on the page even if the text is not exactly the same. Most of the time we know you’ll get it right, but the occasional mistakes will not matter because multiple people are marking, and when you transcribe we check again by asking is this a “Bad Mark”.
In future tutorials we’ll look at the more complex marking required for History Sheets and Attestations.
Measuring the ANZACs Tutorial 1: Classifying pages
Welcome to the tutorials for Measuring the ANZACs. Thanks to the feedback on Talk we’ve identified the issues citizen scientists need to know as we work on this project. Over the next few weeks we’ll be publishing a series of detailed tutorials on the steps involved in working on Measuring the ANZACs. Each tutorial will explain the scientific and research rationale for what we’re doing, and why we’ve set up the workflow in a particular way, and then outline how things work with examples, screen shots, and step-by-step instructions. Please leave comments, and please join us on Talk to ask your questions.
The Measuring the ANZACs data and workflow: Measuring the ANZACs is transforming 4 million pages of soldiers’ personnel files into a structured database. One way to approach this task would be to transcribe the words on every page into a free text database, like a big Word document or blog post.
However a quick look at the pages in the files shows many of the documents have a structure. Take this somewhat random example. It’s a hospital admission form. It even has a standard form number (E.F. 60) suggesting that many of the reports on hospital admissions will collect the same information. The pieces of information that will be collected in this context are pre-printed on the form in bold text. The different responses to these questions are handwritten (and sometimes typewritten). For those of you studied statistics we could refer to the printed text as variables and the handwritten responses as their values. In fact, among the research team that’s often how we do distinguish between the general concepts and the specific answers.
You will also notice that there are lots of different kinds of pages with different questions on them. So the pages themselves are variable. In order to transcribe the information on any page in a structured format we first have to know what kind of page we’re looking at.
When you—as citizen scientists—are looking at a page you can tell what kind of page it is. Often it says exactly what the page is”HISTORY SHEET,” for example. But not always! You’ll see that too, or you’ve seen it, if you’ve been working with us for a while. Early on we had hoped that we would be able to use Optical Character Recognition to identify the types of forms you are looking at. But there are enough pages that don’t have legible titles, or don’t have titles at all, that we soon realized this wouldn’t work at a level of acceptable accuracy. To put it plainly, unless the OCR process was recognizing 90% or more of the pages accurately we’d still be needing human review.
These considerations lead us to order of events in the Measuring the ANZACs workflow
- Classify a page as a particular type of document
- If a page is classified as a document that we are transcribing, mark the fields to be transcribed.
- Transcribe the marked fields.
And that’s all there is to it. Rinse and repeat for 140,000 files and 4 million pages!
The classification of page types will help us set up the database in such a way that other researchers will be able to use it for their research on other topics. If you are researching hospital treatments, for example, it would be great if we had identified all forms relating to hospital admissions, so you could go straight to those pages. That’s what we’re hoping to do. Here’s how we’ll do that, with your help!
Classifying pages
Classifying pages is found under the Mark workflow, so start by selecting either link to Mark.
We eventually want to mark variables on the History Sheet, the Statement of Services (which is really page 2 of the History Sheet), the Attestations, and any form of Death Notifications. These are the options for classifying a page, plus “Other”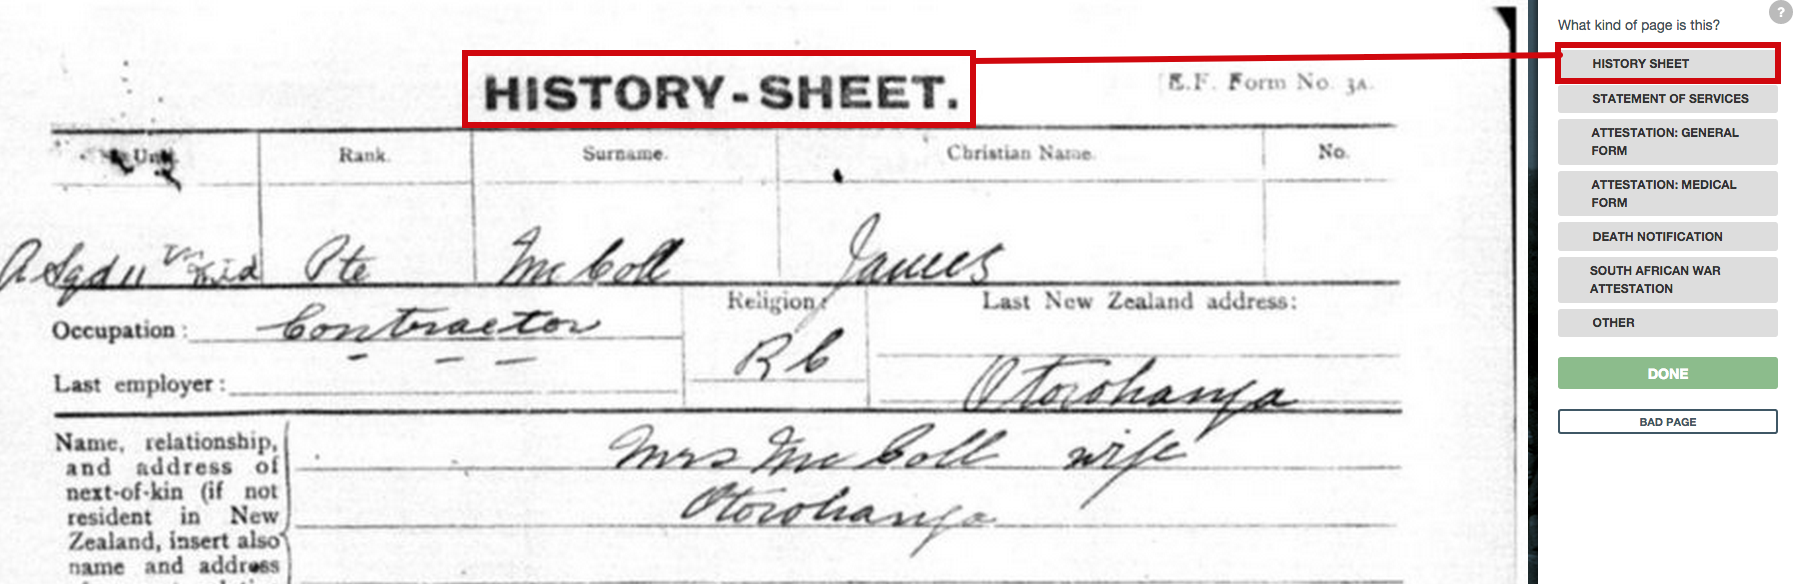
In this example you can see it’s a HISTORY-SHEET”, so you click on History Sheet on the right hand side of the page. The color of the button will change to indicate you’ve selected it. Then you click on NEXT.
If you’ve classified a page as one of the designated types, the next part of the Mark workflow will ask you to mark the variables or fields on the page. That is, identify the things in printed text that have handwritten answers we’re interested in. We’ll cover that involved process in a future tutorial. For now, let’s consider what about the “Other” pages.
What to do with Other pages
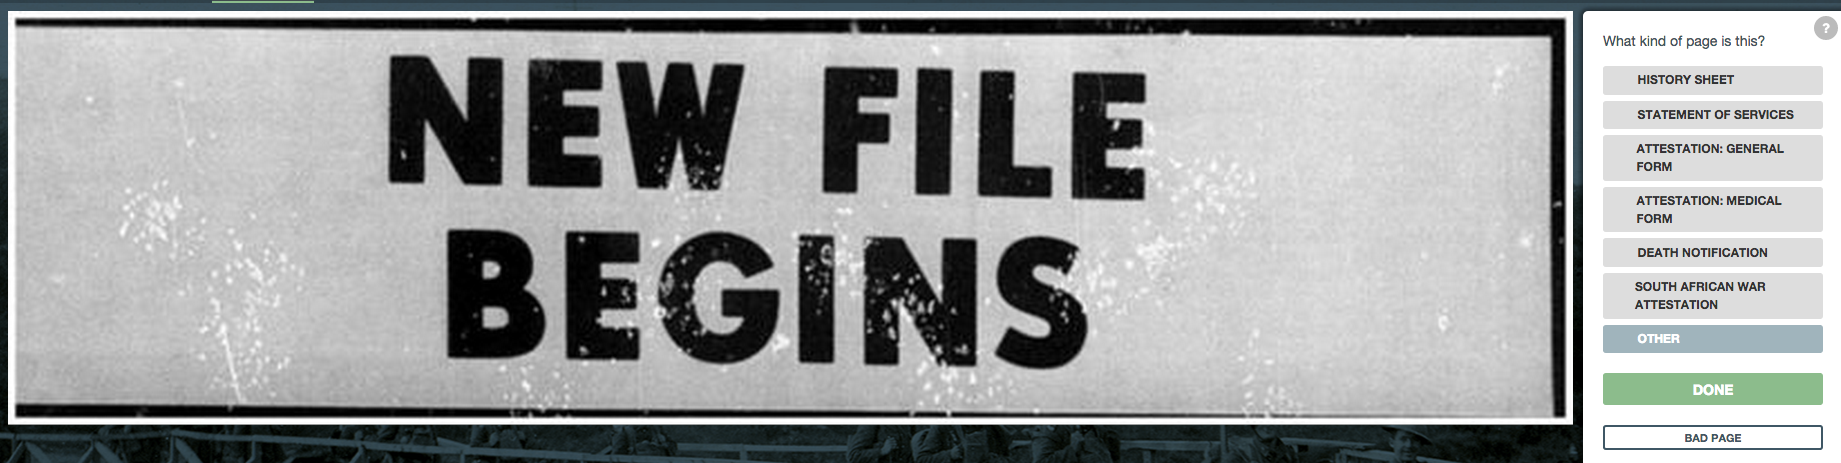
Here’s an image we marked as Other. This is one of the dullest examples — it’s like a place marker in the file. We can probably identify this as a “NEW FILE BEGINS” page using Optical Character Recognition. But stick with me for the example. We mark this as “Other”, and then click “Done”.
If you wanted to describe what this page was (if it was more interesting) you can click on “Transcribe this page now”. This brings up a dialog box that you can type in a free text description of the form. You can move the dialog box around so you can see what’s underneath.
Summary: Classifying what types of pages are in the personnel files is very important to the Measuring the ANZACs workflow. It helps you put the correct variables on the correct pages.
Describing what the “Other” pages are will help other researchers beyond the existing research team use the files in the future by providing links to known pages on known topics. We’re working on ways to make this part of the process go a little smoother and make it more obvious.
Why are there sticky notes on the history sheets?
The material we are using in Measuring the ANZACs is relatively complex. Across 140,000 different files there are around 4 million page images. Thus each file is nearly 30 pages long. The 140,000 distinct personnel files represent a smaller number of distinct individual people. Some people served in both South Africa and World War I, and ended up with distinct files. A more common reason for the existence of multiple files about the same person is that people tried to enlist multiple times. Particularly in the early years of the war the research team has observed people trying to enlist years before they were of age to enlist. These men, teenagers when they first tried to enlist, show up in different attestation files with the same day and month of birth and a different year than in the subsequent (successful) enlistment. The New Zealand Army tried to merge files that were clearly the same person, but did not manage to do it all. One of the outcomes of Measuring the ANZACs when we have completed marking and transcription for all the files, is that we’ll be able to make some educated guesses about people who are really the same person.
So we have a lot of pages and a lot of different people, some of whom might not be different. The complexity that requires citizen science is apparent again looking at the pages. The different files have a widely varying number of pages in them, from just a couple to over a hundred. Someone who enlisted late in the war and saw no active service will tend to have a short file. Someone with longer and more eventful service will have hundreds of pages.
Thus the first task for citizen scientists is to identify what’s in the files. What kind of documents do we have? This is the scientific rationale for the marking process, helping us work out what material we have. We are identifying a small number of the basic documents that most files should have—an attestation form from enlistment, a service history form, and notifications of death. You will notice that on the second page of the history sheets where the “Statement of Services” is recorded the second half of the page is a record of Conduct. Or really, misconduct. At the moment we are just asking for your involvement in marking the Conduct incidents, but not transcribing them. We hope that we can use this identification of the conduct incidents to sample these pages later on in the project and enable research on misconduct during the war.
Misconduct was not uncommon among a hundred thousand men serving overseas. Our introductory post, for example, mentioned the Dibble brothers and their service that included medals and conduct citations for drunkenness. But misconduct was uncommon enough that it doesn’t appear in every file. We just won’t know until we’ve worked our way through the files. The National Library of New Zealand has scanned the reports of the Defence Forces, and they report more than 1,000 prosecutions in the Territorial Forces each year during the war out of 30,000 territorials. We aren’t sure about misconduct in the Expeditionary Force when men served overseas. In any case this suggests misconduct may be recorded in around 5% of the files. This is an example of the complexity of the material that we have to work with, but also the richness and potential for telling the life stories of these men.
The richness and density of information in the files also gives rise to the “sticky notes” you will see on many history sheets.
An example of a sticky noted History sheet.
You will notice that these are not sticky notes that we would see today: commercially made and sold as sticky notes. These are pieces of paper stuck to the paper with paste. They serve the same function as sticky notes today, both physically and intellectually. Sticky notes today are often used to write summaries or notes of the material on the underlying page—that is their intellectual purpose. Their physical form is meant to keep them with the underlying page, but not permanently obscure it.
You will nearly always see a sticky note on the front page of a History sheet. Let me rephrase that. Having looked at thousands of files I’ve never seen one anywhere else. It’s theoretically possible they exist on other documents. Please tell us in the discussion forums if you find another type of page with a sticky note on it!
Look closely at the content of the sticky notes and the content of the History sheets, and you can begin to see the history of these files themselves as working documents for organizing the administration of soldiers in service and as returned soldiers (what Americans would call “veterans” New Zealanders and Australians call “returned soldiers.” The organizations of these men are the RSA in New Zealand and the RSL in Australia). Looking closer at the sticky notes you can see that they summarize the length and places of service. They clearly had a role in the Defence Forces’ processing of medals and pensions. They allowed clerks to quickly see how long a man had served, whether a file had been processed and what actions had been taken.
Like modern day sticky notes these sticky notes contained a summary of information or instructions to action based on the material underneath. It was important not to obscure the information underneath, so only the top of the paper was stuck down. Sticking the paper down with paste also meant that the files were not damaged with pins or staples. These files are now nearly 100 years old in parts, and the paper has not been visibly degraded by the sticky notes. As archivists and historians around the world will tell you pins, staples and rubber bands can do tremendous damage to paper files. In even a slightly damp environment pins, paper clips and staples will start to rust within a decade and damage the paper. So we should be grateful that these files have sticky notes.
The sticky notes presented a technical challenge for both Archives New Zealand (an important partner in Measuring the ANZACs) and the Zooniverse team designing the website. For Archives New Zealand the question was how to scan the material without damaging it, and also present all the information to readers. In the reading room you can lift up the sticky note. There is, as yet, no way to do that in a scanned image! Archives’ solution was to scan the pages with sticky notes multiple times lifting the notes up to reveal the information underneath. Thus, for a History sheet with two sticky notes it may take 3-4 scans to show the whole page including material underneath.

Use the Lightbox feature in the Mark interface to see the next pages. When you see a History sheet with a sticky note, you will see the same page repeat several times to capture all the information. Thus in the Mark workflow you may need to mark several different images to capture the information off what is, in physical form, just one piece of paper. The key to this process is our question to you: Are there any sticky notes. This helps us work out what to do with the page when processing the data.
Seemingly banal, the sticky notes on the History sheets shed light into the working lives of these files as government documents about peoples lives, and also show some of the issues archivists and the research team have had to think about in bringing Measuring the ANZACs to life. As always, if you have questions, bring them to the discussion forums.
Evan Roberts
Why are we Measuring the ANZACs?
Welcome to Measuring the ANZACs. In our introductory post we mentioned that “The international research team began collecting information about New Zealand soldiers to study changes in the height and weight of New Zealanders over time. Height and weight are some of the best information we have to explore the health and material well being of people in the past.”
The science behind using height and weight to study well being is called anthropometrics, and when applied to the past is called “historical anthropometrics” or “anthropometric history”. Scholars who study height and weight in the past are a mix of historians, economists, archaeologists, and anthropologists.Historians and economists are more likely to use written records that describe height and weight for many people, while archaeologists and anthropologists are more likely to use skeletal records. The research team behind Measuring the ANZACs reflects this mix: Kris Inwood and Les Oxley have a background in economics, and Evan Roberts trained as an historian.
The science of anthropometrics is also biological and physiological (the science of human growth and body dimensions is called auxology). Historical anthropometrics relies on the fact that only 80% of the variation in human height is genetic. That is, most of the variation in whether you’re tall or short is because your parents and grandparents were tall or short. Or somewhere in between, as most of us are. The remaining 20% of variation is environmental, and we understand the word environmental to encompass all aspects of the environment in which people grow up: social and economic as well as natural (e.g. climate).
A fascination with how humans grow, and how that varies across different groups is long-standing. For those of you who want to read more a book by James Tanner called A history of the study of human growth is a fascinating read. But the interest in using large samples of records about stature in the past is a fairly recent one, dating to the 1970s. Scholars were interested in two, seemingly disparate, questions: how well off were slaves during American slavery, and what were the living conditions of people in Europe during the Industrial Revolution? Attention to these questions has continued, with much debate about whether the stature of Europeans declined during the Industrial Revolution and whether the heights of American men born in the mid-nineteenth century also declined. These findings are apparent paradoxes, since in other respects, people appeared to be getting better off in the nineteenth century: average incomes were rising.
Anthropometrics recognizes that growth is the culmination of competing forces. When young, growing people are getting enough to eat and meet their basic needs they have energy left over to grow. The phrase “net nutrition” captures the idea that people grow net of other needs for the calories they are taking in. Three factors can affect whether people have enough energy left over to grow
- Food consumption
- Physical exertion
- Disease load
All other things being the same if people eat less (more) food, or do more (less) physical activity, or have more (less) disease they will have less (more) energy for growing. But things are rarely the same, and seeing that people’s heights have changed doesn’t tell us why their heigh changed. Anthropometric history is a powerful scholarly tool for uncovering when in the past there were more or less challenging times to be a growing person. We have to supplement it with other evidence to find out why average stature rose or fell. And it is average stature that matters. Because height varies genetically your height, or my height for that matter, tells us little about whether we were underfed or well fed when we were growing. We need to see how things changed for lots of people to identify the 20% of the variation that is environmental. This, in short, is the science behind why we want to Measure the ANZACs. It can tell us a lot about historical change in New Zealanders well-being and health, and set that in international context.
Our research has already found that New Zealanders were tall by international standards, with adult men standing about 68 inches (173 cm) on average at the end of the nineteenth century. This is important because it confirms that New Zealanders were well off on many dimensions. We also know from our existing research that the indigenous Māori and Pākehā (European settlers and their descendents) stature was nearly the same through the late nineteenth century, and only began to diverge in the twentieth century. This is important because it tells us more about how European settlement affected the Māori population. While Māori population declined the health and well-being of living Māori, at least as reflected in stature was not affected until the twentieth century. In the early twentieth century Māori stature fell behind both absolutely (average stature fell slightly) and relatively (Pākehā stature rose, on average). But in the second half of the twentieth century Māori caught up again with Pākehā. Stature isn’t everything, and other things (income, life expectancy) tell us Māori were not as well off as Pakeha. But stature is something — it tells us that children were in some important ways equally well fed.
Research like ours starts with one question, answers it, and opens others. Our research has answered some basic questions about the level and changes of height and weight in New Zealand. But it has thrown up many questions about how men’s health changed over time. How did health in early life affect how long people lived, and what they did later in life? These questions overlap with our questions about Māori and Pākehā differences where generational changes suggest the importance of long-term influences on health. Answering these questions is why we want to Measure the ANZACs. The stories of these soldiers will help us answer these questions, and they will open up more questions for us and others. We look forward to you joining us in this research.
Evan Roberts
Further reading
Richard Steckel, “The formative period of the new anthropometric history”
Richard Steckel, “HEIGHTS AND HUMAN WELFARE: RECENT DEVELOPMENTS AND NEW DIRECTIONS“
Welcome to Measuring the ANZACs
Welcome to Measuring the ANZACs, a new Zooniverse project. The ANZACs were the Australian and New Zealand Army Corps during World War I. Despite being a long way from the theater of war both Australia and New Zealand sent significant numbers of troops to fight in World War I. From a population of just over one million, New Zealand sent 104,000 men and women to Europe, and Australia sent 375,000 from a population of 4.5 million. Casualty rates among ANZAC soldiers were high, with more than half of the soldiers dead or wounded, leaving an enduring impact on these men and their compatriots.
Under the ANZAC moniker troops from the New Zealand Expeditionary Force (NZEF) and Australian Imperial Force (AIF) fought under a unified command in Gallipoli (1915) and then on the Western front from 1916 to 1918. The name ANZAC soon came to stand more broadly for any Australian or New Zealand soldier in World War I. Today ANZAC still refers to the Australian and New Zealand soldiers from World War I, and to the ongoing relationship and shared history of the two countries. ANZAC also refers to a biscuit (cookie), which you could make to fortify yourself for your expedition into Measuring the ANZACs.
Our goal in Measuring the ANZACs is to recover the story of all those who served, from their lives before the war, through their wartime service, and what happened to them afterwards. We want to know more about who enlisted in the war, how healthy they were, what happened to them in service, and how their experiences affected them afterwards. Putting together thousands of stories of early life experiences, wartime service, and post-war life will help us understand New Zealand’s changing society in the twentieth century, and broader international understanding of changes in health, wellbeing and aging.
The story of the Dibble brothers from Auckland (New Zealand) illustrates some of the questions we will explore using data from Measuring the ANZACs. Victor Thomas Dibble, along with brothers Ralph Ambrose and Jesse Cyril enlisted together in the NZEF in 1916. Victor and Ralph were both bankers, while Jesse was a farmer. Their serial numbers were sequential, 26571, 26572, and 26573. Portions of their service files are mistakenly interleaved with each other. All three served in France in the New Zealand Rifle Brigade.
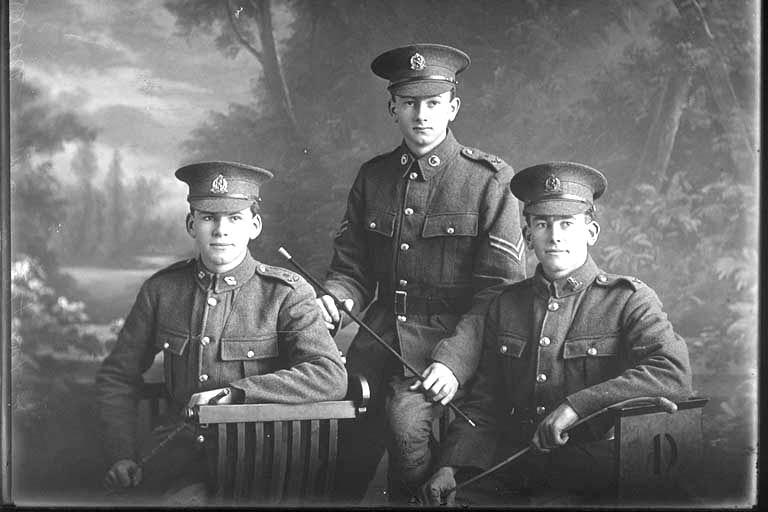
3/4 portrait of three Dibble brothers, Corporal (later Sergeant) Ralph Ambrose Dibble, Reg no 26572 (centre), and Privates Jesse Cyril Dibble(right), Reg No 26571, and Victor Thomas Dibble (left), Reg No 26573, all of the New Zealand Rifle Brigade, 8th Reinforcements to the 4th Battalion, – H Company, 17th Reinforcements.
Jesse’s service was marked with both distinction (receiving a Croix de Guerre from the Belgian government) and disciplinary issues including overstaying and drunkenness. Ralph’s service was more ordinary than his brothers, staying in service until the end of the war. In 1917 he was evacuated to England for treatment of a lacerated hand suffered when trying to open a bottle by banging it against a bank. Letters in his file show that despite the incident being his own fault he was not disciplined and given base duty while he recuperated. Victor meanwhile was injured in action by a shell, and had his left leg amputated. He recuperated in England at Oatlands Park, and returned to New Zealand in February 1919. All three had survived the war unlike 18,166 of their compatriots.
Victor married in 1927, and his rehabilitation training helped him gain a job as the Secretary to the Manawatu Racing Club in Palmerston North three years later. But in 1932 Victor’s body was discovered on the grounds of the race course. He had shot himself. More than a decade after the war ended it still enacted its toll on New Zealand’s soldiers. Jesse Dibble served in World War II and lived to be 81, while Ralph returned to his job in the National Bank and lived to age 93. The story of these brothers who grew up together, enlisted together, fought together, and came home together encapsulates many of our goals in Measuring the ANZACs.
We are excited to be working with you towards our goal of creating a complete set of data on the 120,000 New Zealanders who served in the South African War and World War I. Working together we think we can do this by November 2018, 100 years after the end of the war. Along the way we’ll learn a tremendous amount about the men and women who served.
Measuring the ANZACs is already a big collaboration, and we’re excited to bring you into the research team. The project would not be possible without the efforts of Archives New Zealand in the past decade to organize and digitize millions of pages of records from the 140,000 personnel files of South African War and World War I service members. With a complete set of transcribed records for individual personnel it will be easier for you to find out about the history of the people who served, a process that at the moment requires knowing a name or serial number. With more information it will be possible to find people or groups in different ways to trace the history of your family’s involvement in the war.
Measuring the ANZACs is also the basis of academic research about New Zealand’s economy and demography in the past. The international research team began collecting information about New Zealand soldiers to study changes in the height and weight of New Zealanders over time. Height and weight are some of the best information we have to explore the health and material well being of people in the past. By collecting information on thousands of people we can see how height and weight varied, for example, by what jobs people were doing, where and when they were born, and what ethnicity they were. The differences in height and weight allow us to determine which groups in the population were doing better or worse in their material and physical conditions of life. By tracing some of the soldiers to the end of their life we have been able to examine why life expectancy improved in the twentieth century, and the impact of height and weight on how long people lived.
To date the research team have collected the records of 23,000 men from the South African War and World War I. By expanding the amount of information six-fold the researchers will be able to examine more precisely what influenced people’s health, height and weight. Did people in certain cities do better or worse? Were major events like recessions and strikes bad for people’s health?
Throughout the project we will release data from Measuring the ANZACs for your research. Many people will be able to find out what happened to relatives who fought and to see them in the context of their friends, community and the New Zealand population. Historians will be able to examine a wide array of new questions including social networks among the troops, inter-marriage between Māori and Pākehā, and the experience of nurses in the military, and much more besides.
Welcome to Measuring the ANZACs, we look forward to the research and discovery ahead of us together.
Evan Roberts
