
Putting the A in Measuring the ANZACs
In our name Measuring the ANZACs has a vision of measuring all the ANZACs. We’ve started with the “NZACs”. Today we’re going to talk about the “A” for Australia. Our collaboration with you to transcribe the New Zealand records has relied on
- The preservation and organization of the personnel files for 90 years by the NZ Defence Force
- The digitization of all 3.7 million page images by Archives NZ.
- Our collaboration with the Zooniverse
You are helping us with step 3, but if the literal century of work had not been done by others, we could not do anything. Records could easily have been destroyed, or remain hard to access as paper files. What are the prospects for measuring all of the ANZACs?
The National Archives of Australia has scanned and published as digital images the personnel records of the Australian Imperial Force (AIF), which acted as the country’s overseas armed forces during the First World War.[1] The 376,000 AIF files survive intact and contain a more consistent set of documents than the British, and are remarkably similar to the New Zealand records.[2]
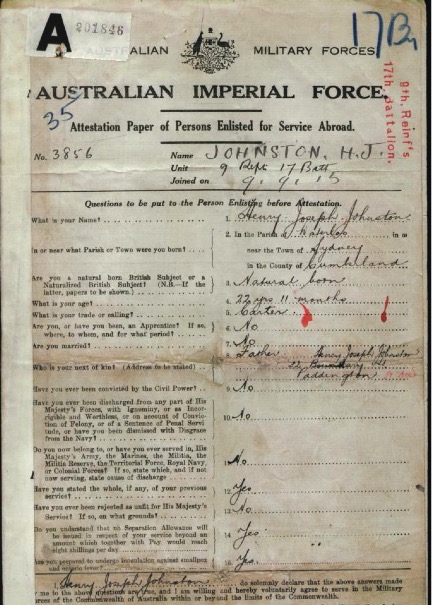
There is a long history of Australian historians and scholars using the personnel files. In fact within the Commonwealth, Australian researchers pioneered the use of First World War service records as an historical source. [3] Access to the service files necessarily relies on metadata that act as index fields. The AIF metadata includes name, place of birth, place of enlistment, next of kin and service number. This metadata is slightly richer than the NZ records. But there remains much information of research interest additional to the metadata that must be transcribed on an image by image basis. What if we want to know which Australians served at Gallipoli, or were wounded? We need to transcribe all the records to find out!
Some research has already been done with the Australian records by Kris Inwood—a researcher on the Measuring the ANZACs team—and other colleagues. In Australia the attestation documents were transcribed for every soldier, nurse or officer whose name began with the letter B. This letter has the advantage of being easily discernible in most hand-writing. Moreover, B-surnames are common among relevant ethnicities.[4] The resulting databases includes 35,000 Australian records, or about 10% of the AIF.[5]
As with the New Zealand research we described in an earlier blog post Inwood has used the personnel data to study the Australian standard of living. This research, which follows an earlier literature using US Civil War personnel records and British army records extending back to the eighteenth century, begins with the premise that the patterns of adult stature for a large enough population reflect living conditions in childhood.[6]
The basic idea in this literature is straightforward. If a child is exposed unduly to various diseases, or does not receive a sufficiently nutritious diet, or engages in child labour too early in life, then physical growth is stunted to some degree, and the individual will not realize her or his genetically-endowed potential stature. The growth-retarding impact of adverse childhood conditions may be ameliorated if conditions improve but the ‘catch-up’ is likely to be incomplete. If child growth is impaired for a sufficient number of individuals in a population, then average adult stature for the population will be diminished.[7]
In a recent comparative paper Inwood and colleague John Cranfield show that Australia’s economic growth slowed in the 1890s but child health nevertheless improved relative to Canada, judging by the divergence in adult stature for labourers born in the 1890s (Figure 3). Opposing forces were at work in the two economics. An erosion of working class standards was the dark side of the biggest economic boom in Canadian history.[8] For Australia, in contrast, the dramatic slowing of economic growth in the 1890s had many consequences but it clearly did not impede the advance of living standards.[9] Indeed, the reduction in immigration and population growth probably reduced the intensity of some diseases and contributed to the improvement in child well-being.[10]

As with the New Zealand research we described a few months ago, one of the limitations of the existing research is that we cannot make fine distinctions between cities or years. We would love as researchers to know whether Sydney was healthier than Melbourne, and whether cool Hobart or warm Brisbane was worse than both. Researchers beyond the Measuring the ANZACs team can use a complete transcription of the AIF records to understand who fought in the AIF and in what battles, and to uncover more of the hidden history of Aboriginal participation in the AIF.
The ANZAC name itself shows that while New Zealand and Australia were different countries they had a deeply shared history. Measuring the ANZACs can uncover not only the ANZAC campaign in World War I, but the intertwined personal connections of migration and ancestry that linked the two countries.
Onwards with transcribing, Measuring the ANZACs forces!
(For more information on the topics discussed in this blog post, please see the recent article in Australian Historical Studies by Kris Inwood and J. Andrew Ross)
Notes
[1] http://www.naa.gov.au/collection/explore/defence/service-records/army-wwi.aspx January 24 2016. The archival reference is National Archives of Australia. First Australian Imperial Force Personnel Dossiers, 1914-1920. Series B2455. Another useful database was created by scanning the rolls of those who embarked for overseas service: https://www.awm.gov.au/research/people/nominal_rolls/first_world_war_embarkation/introduction. The printed embarkation rolls comprise a subset of all AIF and offer a subset of information recorded in the personnel records.
[3] L.L. Robson, “Origin and character of the first A. I. F., 1914-1918: Some Statistical Evidence,” Historical Studies 15 (1973): 737-749; G. Whitwell, C. de Souza and S. Nicholas, “Height, Health and Economic Growth in Australia, 1860-1940,” in Health and Welfare during Industrialization, eds. Roderick Floud and Richard H. Steckel (Chicago: University of Chicago Press, 1997), 379-422; G. Whitwell and S.Nicholas, “Weight and welfare of Australians 1890-1940,” Australian Economic History Review, 41 (2001): 159-75; Ralph Shlomowitz, “Did the mean height of Australian-born men decline in the late nineteenth century?” Economics and Human Biology 5 (2007): 484-488.
[4] Pat Thornton and Sherry Olson, “A Deadly discrimination among Montreal infants, 1860-1900,” Continuity and Change 18 (2001): 95-135.
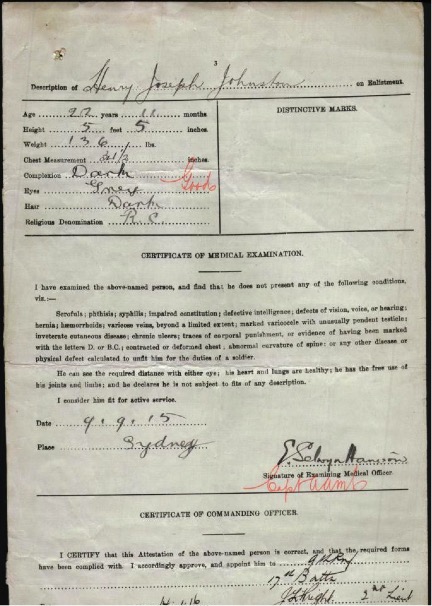
[5] Only attestation papers are available for Britain and South Africa; we were able to consult a wider range of documents including reports of medical examinations for Australia, Canada and New Zealand.
[6] Robert W. Fogel, Stanley L. Engerman, Roderick Floud, Gerald Friedman, Robert A. Margo, Kenneth Sokoloff, Richard H. Steckel, T. James Trussell, Georgia Villaflor and Kenneth W. Wachter, “Secular Changes in American and British Stature and Nutrition,” Journal Interdisciplinary History 14 no. 2 (Autumn 1983): 445–81; Robert A. Margo and Richard H. Steckel, “Heights of native-born whites during the antebellum period,” Journal of Economic History 43 no. 1 (1983): 167–74; Roderick Floud, Kenneth Wachter, and Annabel Gregory. Height, health and history: Nutritional status in the United Kingdom, 1750-1980 (Cambridge: Cambridge University Press, 1990).
[7] Barry Bogin, Patterns of human growth, 2nd ed. (Cambridge: Cambridge University Press, 1999); Richard H. Steckel, “Stature and the standard of living,” Journal of Economic Literature 33 (1995): 1903-40; Richard H. Steckel, “Biological Measures of the Standard of Living” Journal of Economic Perspectives 22 (2008): 129–152.
James M. Tanner, Foetus into man: Physical growth from conception to maturity (Cambridge: Harvard University Press, 1978); James M. Tanner, A history of the study of human growth (Cambridge: Cambridge University Press, 1981).
[8] Terry Copp, The Anatomy of Poverty: The Condition of the Working Class in Montreal 1897-1929 (Toronto: McClelland & Stewart, 1974); David Gagan and Rosemary Gagan,”Working-Class Standards of Living in Late-Victorian Urban Ontario: A Review of the Miscellaneous Evidence on the Quality of Material Life,” Journal of the Canadian Historical Association 1 (Spring, 1991): 171-194; Martin Tétreault, “Les maladies de la misère. Aspects de la santé publique à Montréal, 1880-1914,” Revue d’histoire de l’Amérique française 36 no. 4 (1983): 507-526; Thornton and Olson, 95-135.
[9] R.V. Jackson, “Trends in Australian living standards since 1890,” Australian Economic History Review 32 (1992): 24–46; R.V. Jackson and Mark Thomas, Height, weight, and well-being: Sydney schoolchidren in the early twentieth century,” Australian Economic History Review 35, no. 2 (September 1995): 39-65; Ian W. McLean and Jonathon Pincus, “Did Australian living standards stagnate between 1890 and 1940?,” Journal of Economic History 43 (1983), 193–202.
[10] W. A. Sinclair, “Economic growth and well-being: Melbourne 1870–1914,” Economic Record 51 (1975): 153–73.
Prisoners of war
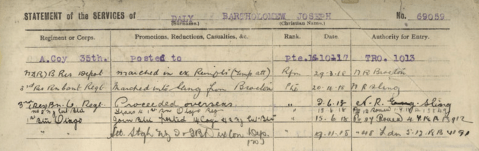
One of our motivations for working with you all on Measuring the ANZACs is to bring rare stories to light. We can do this together by indexing the files on more dimensions than are currently listed, so small groups of men with similar wartime experiences can be identified and studied together, or individually.
One example of how military experiences interact with our research on health and longevity is the question of prisoners. We were reminded of this when a member of the Measuring the ANZACs community shared this file of Thomas Michael Lynch (58995) with us on Talk (join the conversation and share your finds and questions!)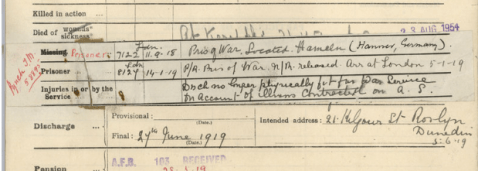
Being a prisoner was quite rare among New Zealand’s World War I soldiers in contrast to World War II, about much which more has been written. It seems that the experience of these men needs to be told. It’s a great topic for an Honours or MA thesis!
Being a prisoner and surviving to come home distinguishes these men in an interesting way. How did it affect their health later on? You might suppose that being a prisoner would shorten your life, owing to the stress and deprivation. On the other hand, sometimes being a prisoner meant a lower risk of further injury on the battlefield. A fascinating study of American Civil War prisoners by Dora Costa found that “Among severely stressed former Union Army prisoners of war (POWs), the effect that dominates 35 years after the end of the Civil War depends on age at imprisonment. Among survivors to 1900, those younger than 30 at imprisonment faced higher old-age mortality and morbidity and worse socioeconomic outcomes than non-POW and other POW controls, whereas those older than 30 at imprisonment faced a lower older-age death risk than the controls.” But studies of World War II POWs from Australia and the US have typically found that being a prisoner of the Japanese was bad for men’s health in the long-term.
World War I may have been different again, but we don’t know. There have not, as best we can tell, been any studies of what happened after the war to World War I prisoners. As with suicide in which you are helping us do important research, the files of New Zealand’s prisoners could tell us a lot. Help us tell their stories, and what happened to them after the war. Onwards with transcribing!
One year of Measuring the ANZACs with you
It’s our first birthday! This time a year ago we were incredibly excited to get the project publicly launched after several months of development time, and feedback on the beta.
Anniversaries and birthdays are a great time to take stock and share with our friends and partners what we’ve learned in the past year, and where to from here.
Achievements
Our two biggest achievements are related. First, the system we built on Scribe has worked to enable the separation of marking and transcription, and having you help us with the transformation of structured but messy records on paper into structured machine-readable records.
Social science and humanities databases are hard enough to construct with teams of research assistants or classes working alongside you. One needs systems with some optimum combination of flexibility and rules. For example we shouldn’t see anything but numbers in answer to a question “How old in years is this man”. But in reality, we do see other things. Not often, but the times you see notes beside the man’s age we need some ability to capture that information, because it’s probably going to be interesting. Multiply these kinds of challenges across the 147 different variables we’ve identified in the personnel records, and taking it to the crowd is going to be challenging.
Our approach has been to collect nuggets of information. You mark a field, then it’s available for transcription. Repeat 147 fields x 3 iterations of each transcription x 140,000 soldiers (and that’s an undercount, because some fields repeat. People were wounded or transferred between units many, many times …)
Second, because the system is relatively easy to use we’ve built a great community of markers and transcribers. Thank you! We couldn’t do this all by ourselves, and the data we’re creating will be a shared resource for scholarship, a memorial to the men who are recorded herein, and a way to open up the stories of the men to a much wider audience. At the end of the project we’ll have the records indexed by much more than the name and serial number they’re currently indexed by. Want to find all the men born in Wellington? It’ll be easy (so get transcribing! Go now!)
Challenges
No one gets through their first year without a few challenges. We’d like to thank you for bearing with us while the server was quite unstable in the first couple of months! It was a little trying.
The challenges have been smaller than the achievements, but we know we haven’t had a perfect year. In the first instance getting 3.5 million images across the Pacific from Archives New Zealand computers to ours has been time consuming. On this end they have to be processed into a new database before they can appear on the site. It’s not as easy as just pointing our interface at the complete collection you can find on Archway.
This means we still don’t have everyone up. The promise that you can come along and easily find your relatives or other people you’re interested in hasn’t quite been realized. We know this is important, and we’re working on it. One of the things that makes Measuring the ANZACs different from ecology or astronomy projects is that our data represents known entities. People! Actual people you’ve heard about. The architecture of the Zooniverse was built around a slightly different type of data. The good news is, again, we’re working on it. At the Zooniverse we know that transcription is important to bring citizen science to the social sciences and humanities, and these are part of the changes we have to make (go check out the other great transcription projects, then come back here).
We’ve also found that transcription is hard. There’s less immediate gratification in a little bit of transcription, than classifying an image with animals in it, or identifying stars. I know, because I’ve done the other thing. Finding the community of people who are interested and committed to the slightly harder work of transcription is an ongoing joy of reaching out through social media, giving talks, and mentioning what we’re doing whenever we can. Which leads us to
Gratitude
We’re incredibly grateful for the support of the Zooniverse, and the leadership team there of Lucy Fortson and Chris Lintott who are a joy to work with. Archives NZ and Auckland Museum have been incredibly helpful as well in spreading the word, and without Archives incredible efforts to scan all this material we wouldn’t have a project. Measuring the ANZACs is a Zooniverse at UMN project, and we thank UMN for their financial support of that intiative (check out the new UMN project Mapping Change about biodiversity). Our efforts to get all of the men’s stories transcribed is fundamentally about studying a population, and the support of the Minnesota Population Center is also important to us.
Beyond the team we work with, we’ve been thrilled to join the wider community of people interested in how we can transform handwritten text into useful machine-readable data in the social sciences and humanities. We’ve talked to classes at Carleton College, faculty and students at George Mason (Center for History and New Media) and Macalester, and to THATCamp Twin Cities. It was an incredible honor to give the ANZAC Lecture in April at the Center for Australian, New Zealand and Pacific Studies at Georgetown. In Wellington we were glad to give talks at the National Library, Wellington High School to the Wellington History Teachers Association, and Victoria University.
We started incorporating material uncovered by our citizen scientists into our research on post-war suicide; an important and sad topic where we can make a start with small numbers of men’s stories. Your help in uncovering these rare stories is helpful. We are still a little while from having enough completely transcribed men to fold them into our measurements of the ANZACs (so get transcribing!).
We are grateful for the press coverage we’ve received on the BBC, TV One, TV3 and Stuff.
The road ahead
Millions of fields transcribed is an incredible achievement, and we thank you for it. It’s not yet enough because there are tens of thousands of men whose files haven’t been touched. But we do have enough data to start addressing a very fundamental methodological problem: how accurate is citizen transcription? This takes us back to the starting point of this blog post. Our alternative is enlisting (really, conscripting or employing) the help of undergraduate and graduate students. Looking at what you have transcribed we think the quality is pretty good, but we need to, you know, measure that and put a number on it.
Unusually for a transcription project we have two validated “gold standard” data elements in our data. The men’s names and serial numbers are part of the “metadata” from the NZ Defence Force and Archives New Zealand, and represent the truth about how names were spelled and the assigned serial number. What did you actually transcribe, how much do the errors matter, and where do they occur? These kinds of metrics will be important in the acceptance of citizen science data as a scholarly source, and we’ll be presenting first results at the Social Science History Association conference in Chicago in 6 weeks.
It’s been a great year, we’ve learned a lot, met a lot of new people, and collaborated to build a platform to remember and understand 140,000 men’s live. Here’s to just a few more years of transcribing, and many years of remembering, understanding and studying. Thank you!
